Silas & Müllensiefen (2023) online supplement
silas_and_mullensiefen_2023_online_supplement.RmdThe following are supplementary materials for:
Silas, S., & Müllensiefen, D. (2023). Learning and recalling melodies: A computational investigation using the melodic recall paradigm. Music Perception.
1 Short melodic excerpts from pop songs used as materials in the study
| No. | Song | Composer/Interpreter | Genre/Meter | Tempo |
|---|---|---|---|---|
| 1 | Children Of The Night | R. Marx | Pop 4/4 | 75 |
| 2 | Climb Up | N. Sedaka | R´n´R 4/4 | 120 |
| 3 | Cold Cold Heart | M. Pellow | Pop 4/4 | 80 |
| 4 | Do You Want To Dance? | R. Freeman | R´n´R 4/4 | 100 |
| 5 | Du gehörst zu mir | J. Heider | Schlager 4/4 | 120 |
| 6 | Longer | D. Fogelberg | Pop-Ballade 4/4 | 80 |
| 7 | Oh Carol | N. Sedaka | Pop-Ballade 4/4 | 140 |
| 8 | Take Good Care | C. King | Ballade 4/4 | 120 |
| 9 | The Sky Is Crying | M. Levy | Blues 12/8 | 60 |
| 10 | You Are My Destiny | P. Anka | Schlager 12/8 | 85 |
| 11 | Goodbye My Love Goodbye | M. Panas / D. Roussos | Schlager 4/4 | 114 |
| 12 | Enjoy Your Life | Funky Be | HipHop 4/4 | 85 |
| 13 | Love Is Like A Rainbow | T. Anders | Disco-Pop 4/4 | 155 |
| 14 | Let Me Be Your Only One | Funky Be | HipHop 4/4 | 100 |
2 An example of one melody from each pop song.


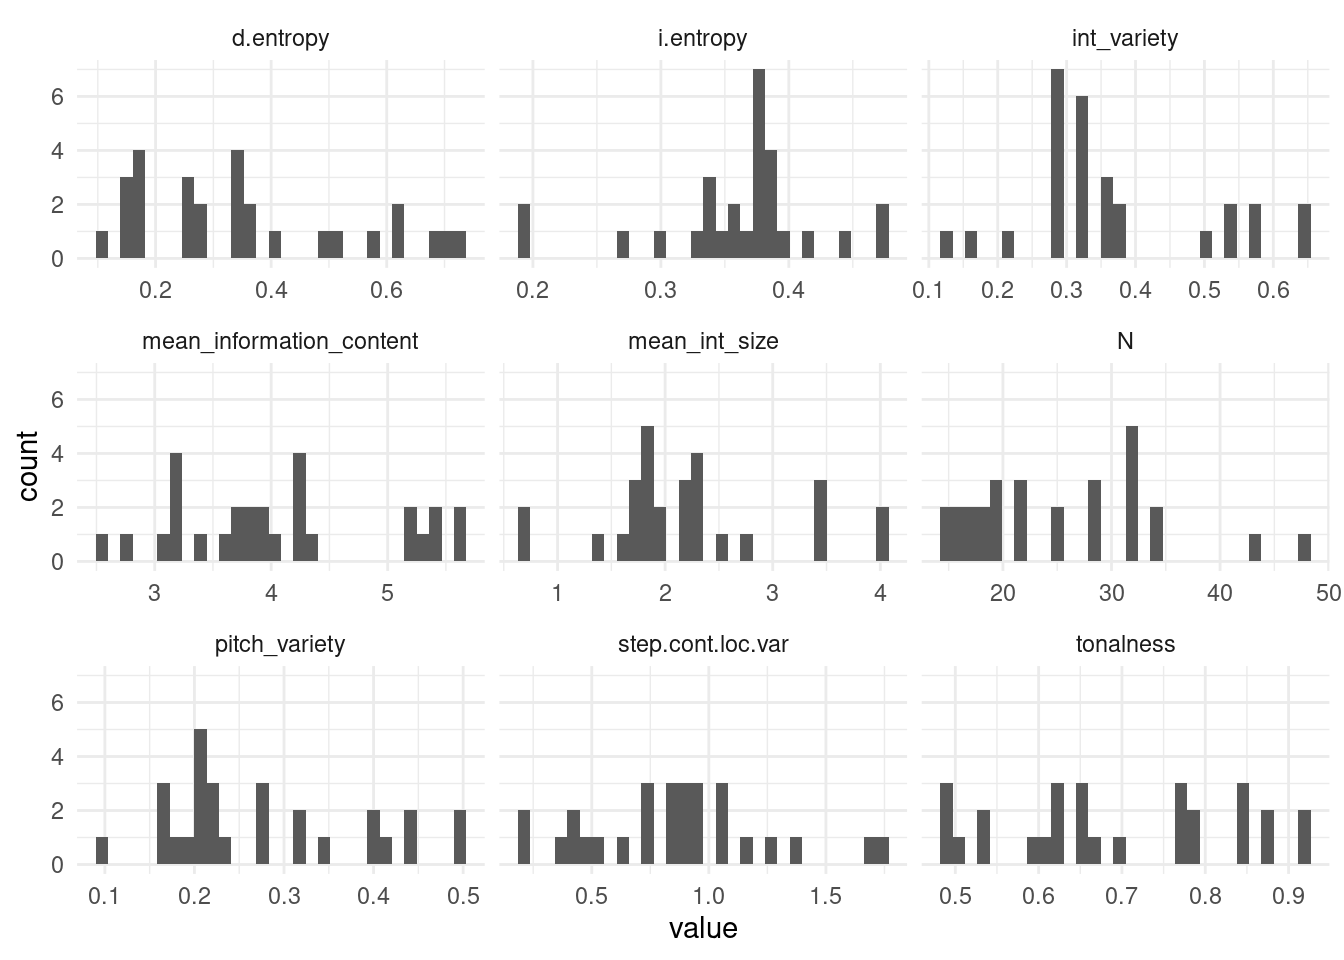
2.2 Melodic feature summary statistics
| Feature | Mean | SD | Coefficient of Variation |
|---|---|---|---|
| d.entropy | 0.36 | 0.19 | 0.53 |
| step.cont.loc.var | 0.86 | 0.38 | 0.44 |
| pitch.variety | 0.28 | 0.11 | 0.40 |
| mean.int.size | 2.21 | 0.84 | 0.38 |
| int.variety | 0.37 | 0.13 | 0.37 |
| N | 25.39 | 8.66 | 0.34 |
| mean.information.content | 4.07 | 0.89 | 0.22 |
| tonalness | 0.69 | 0.14 | 0.20 |
| i.entropy | 0.36 | 0.06 | 0.18 |
3 Questionnaire items
| Variable | Question | Response Format |
|---|---|---|
| chorusin | Do you sing in a choir? | Yes/No |
| singinstr: | Have you ever received singing instructions? | Yes/No |
| yearsins | For how many years have you been playing an instrument or making music? | __years |
| musmakpa | During your most active musical phase how many hours per week did you make music (practice+rehearsal+gigs+lessons+playing+etc.) | __hours/week |
| paidless | For how many months have you received paid instrumental or singing lessons? | __ months |
| paidgigs | How many gigs have you played that you have been paid for? | ___gigs |
| gigs | Overall, how many gigs have you played in front of an audience in your life? | ___gigs |
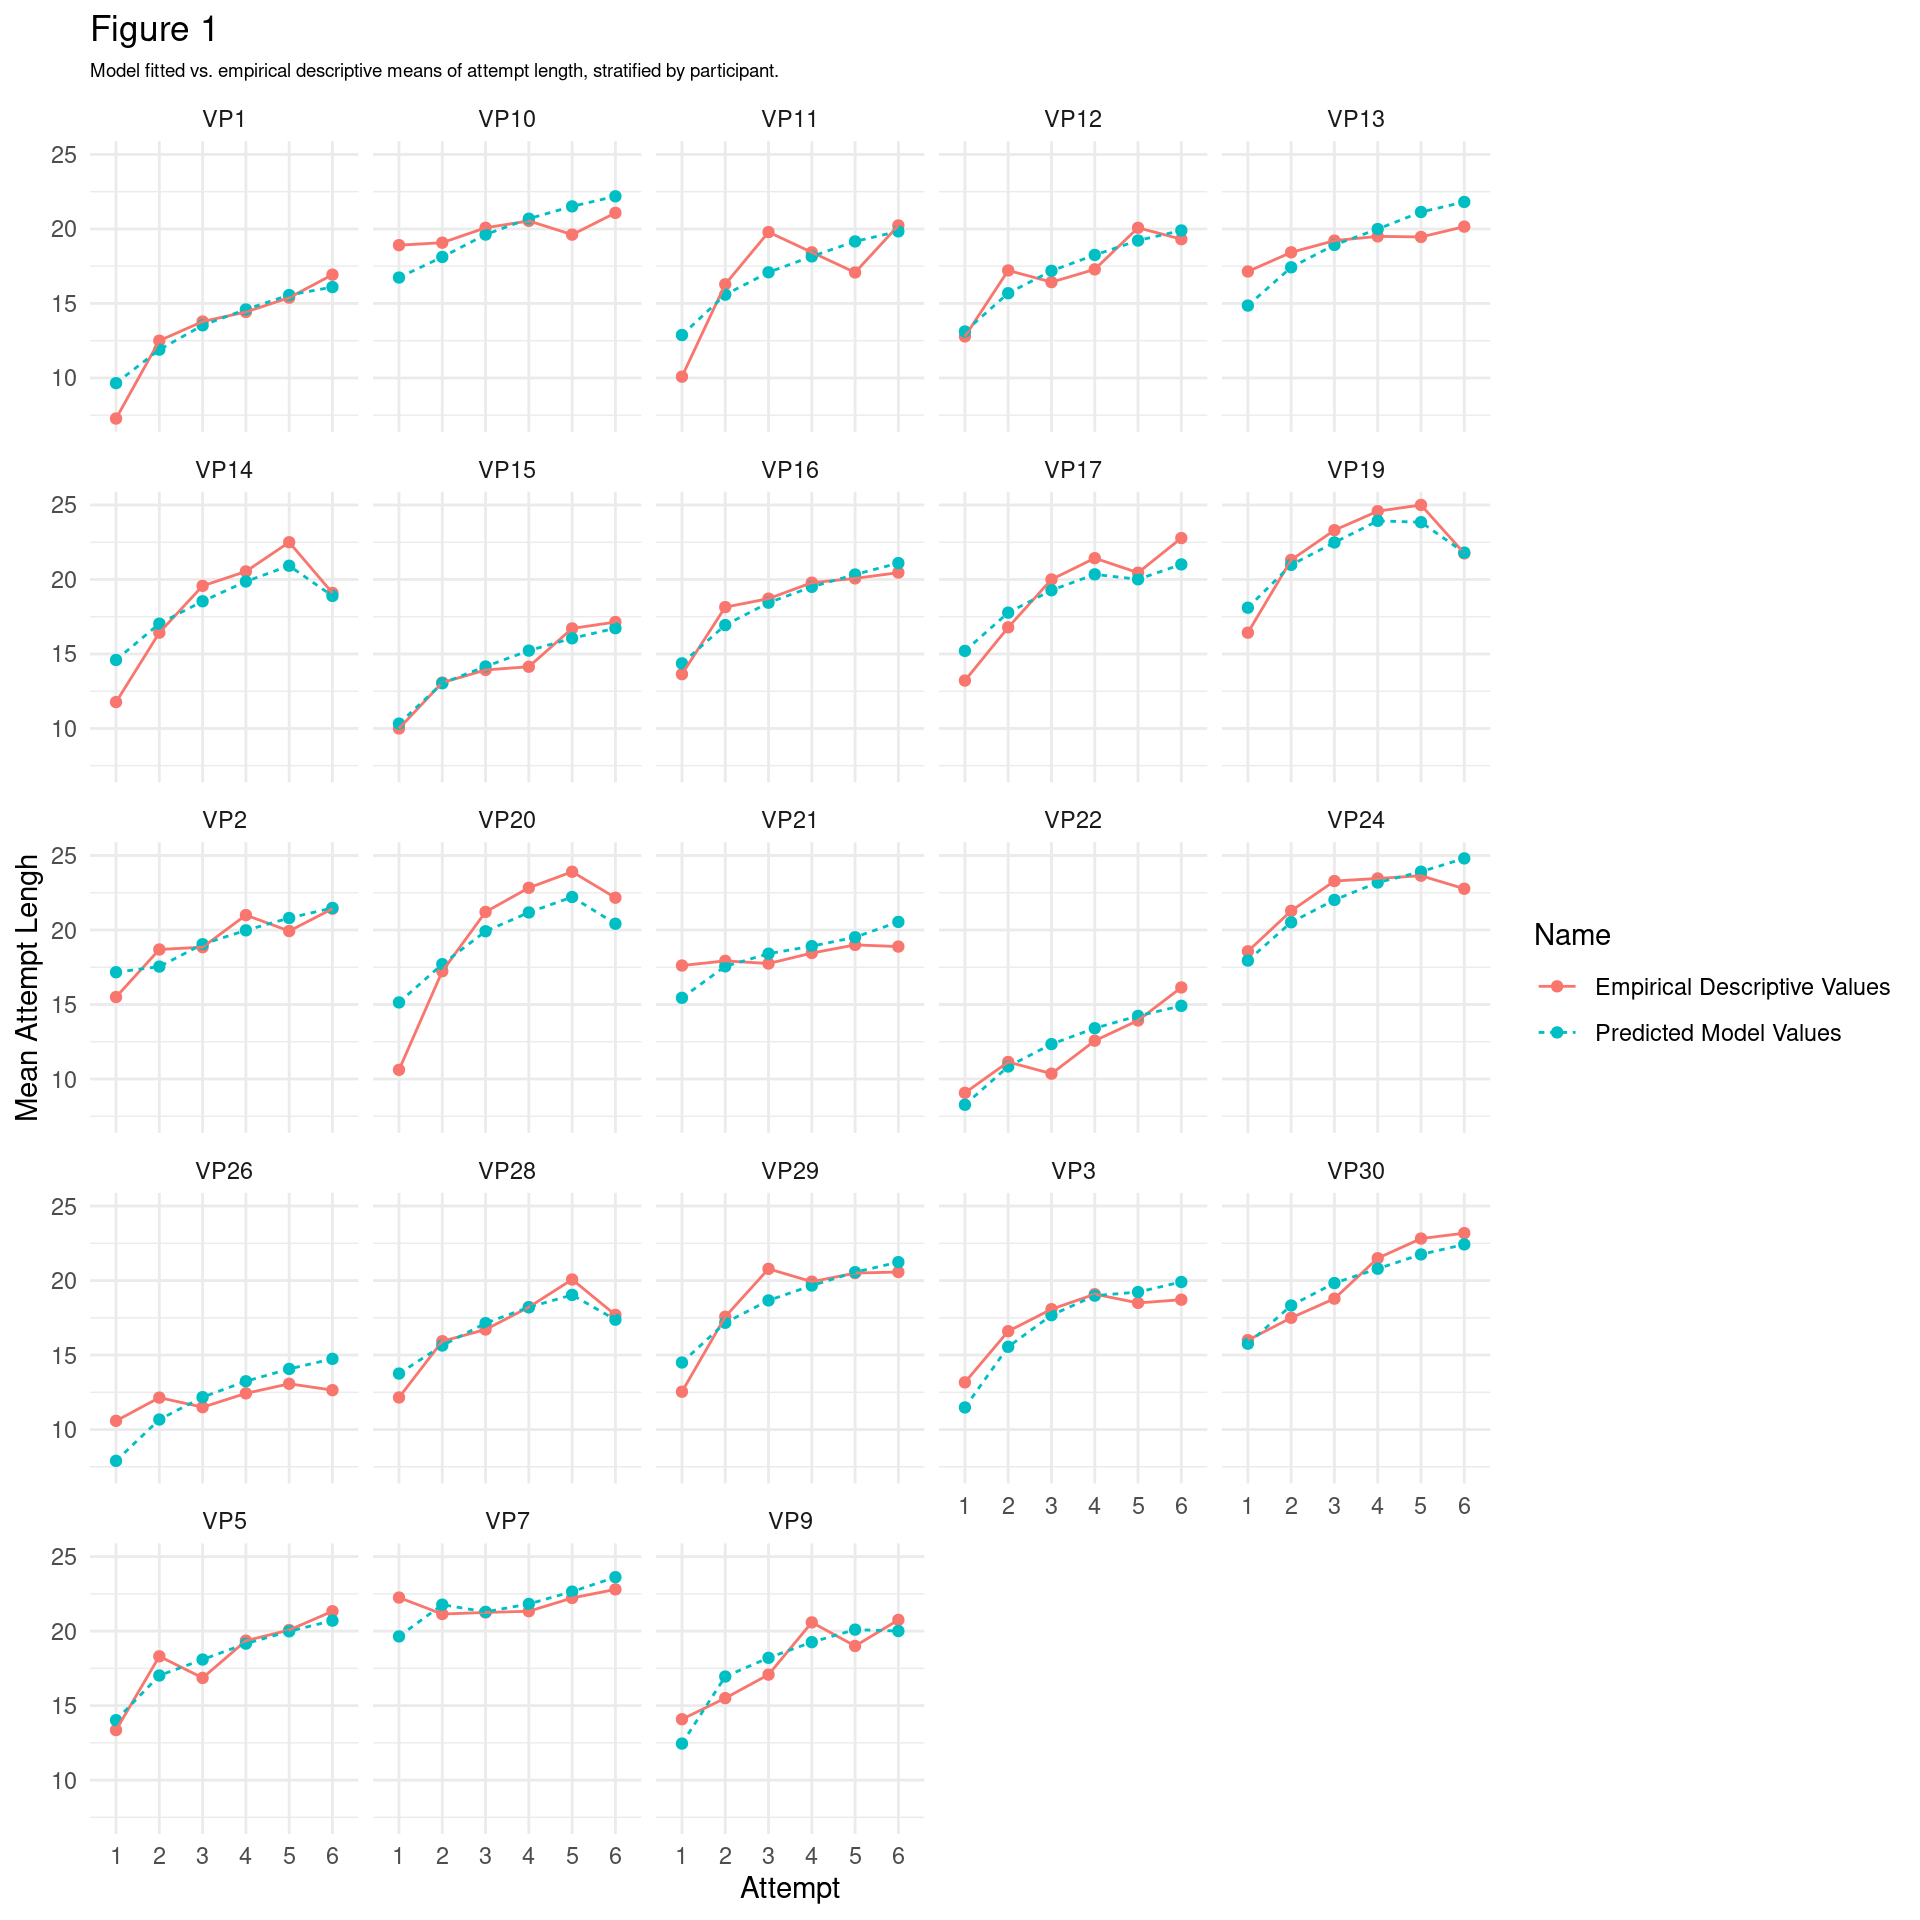
4 Average by-participant performance across attempts
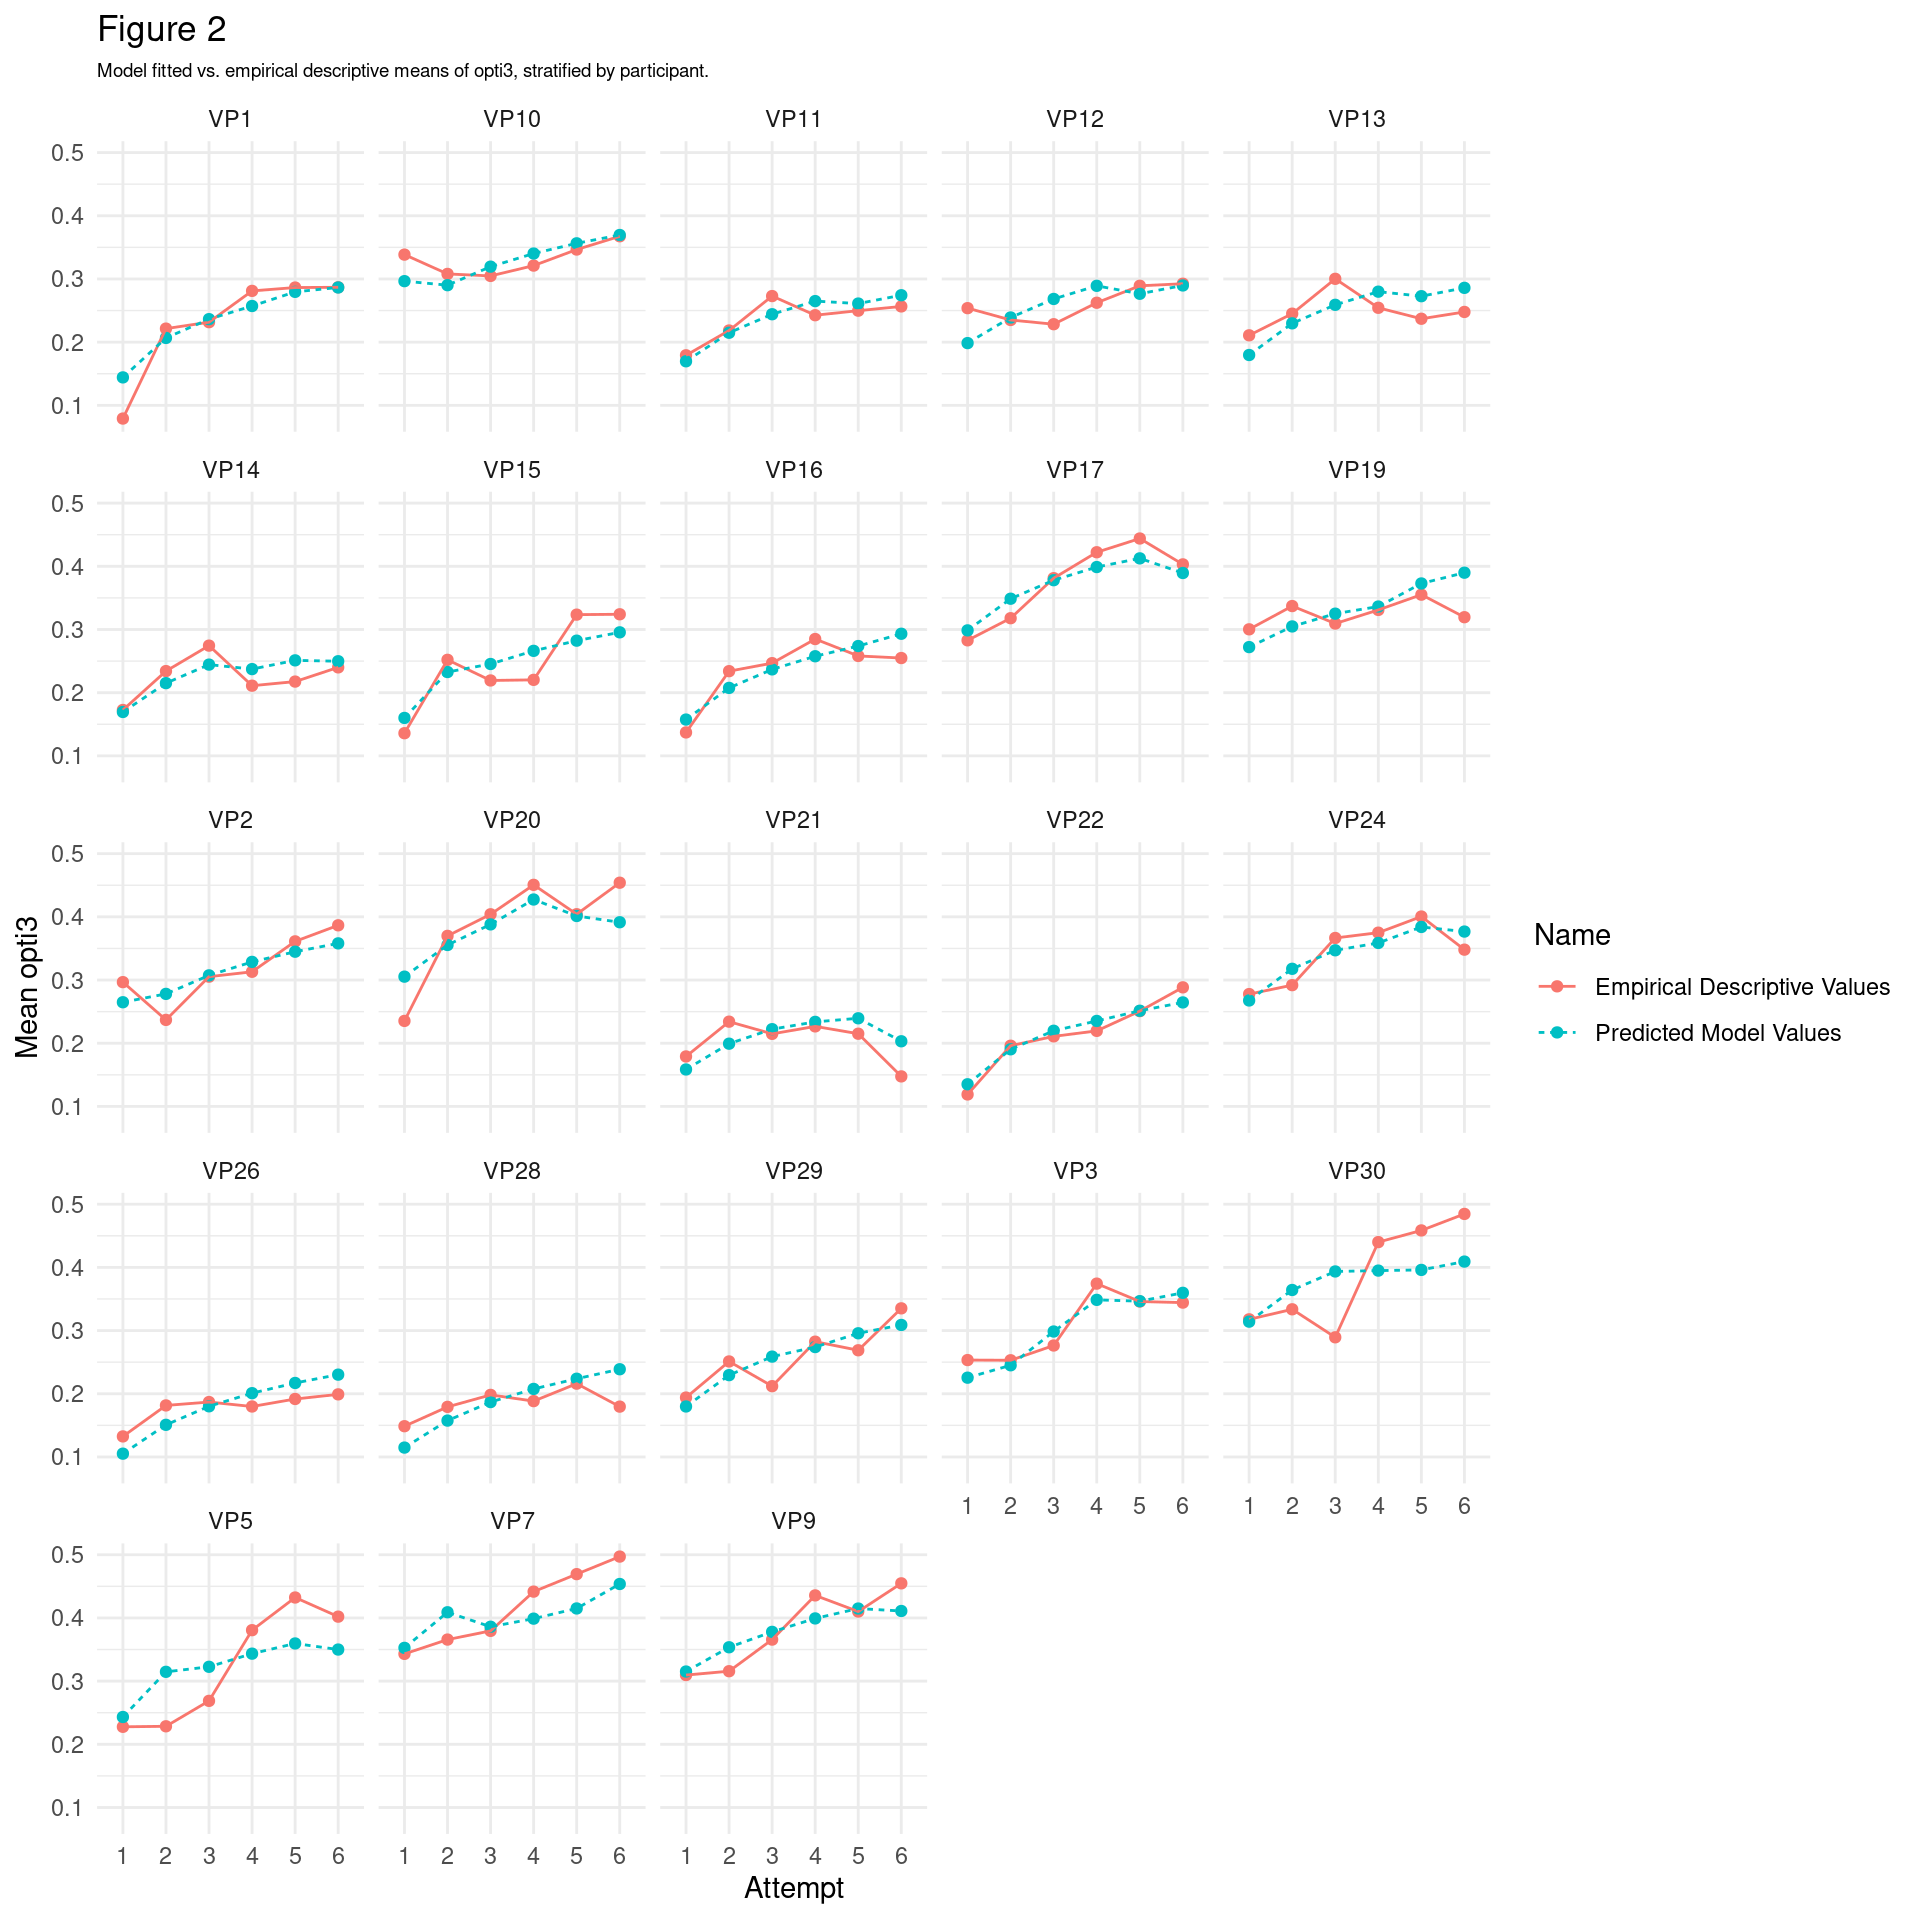
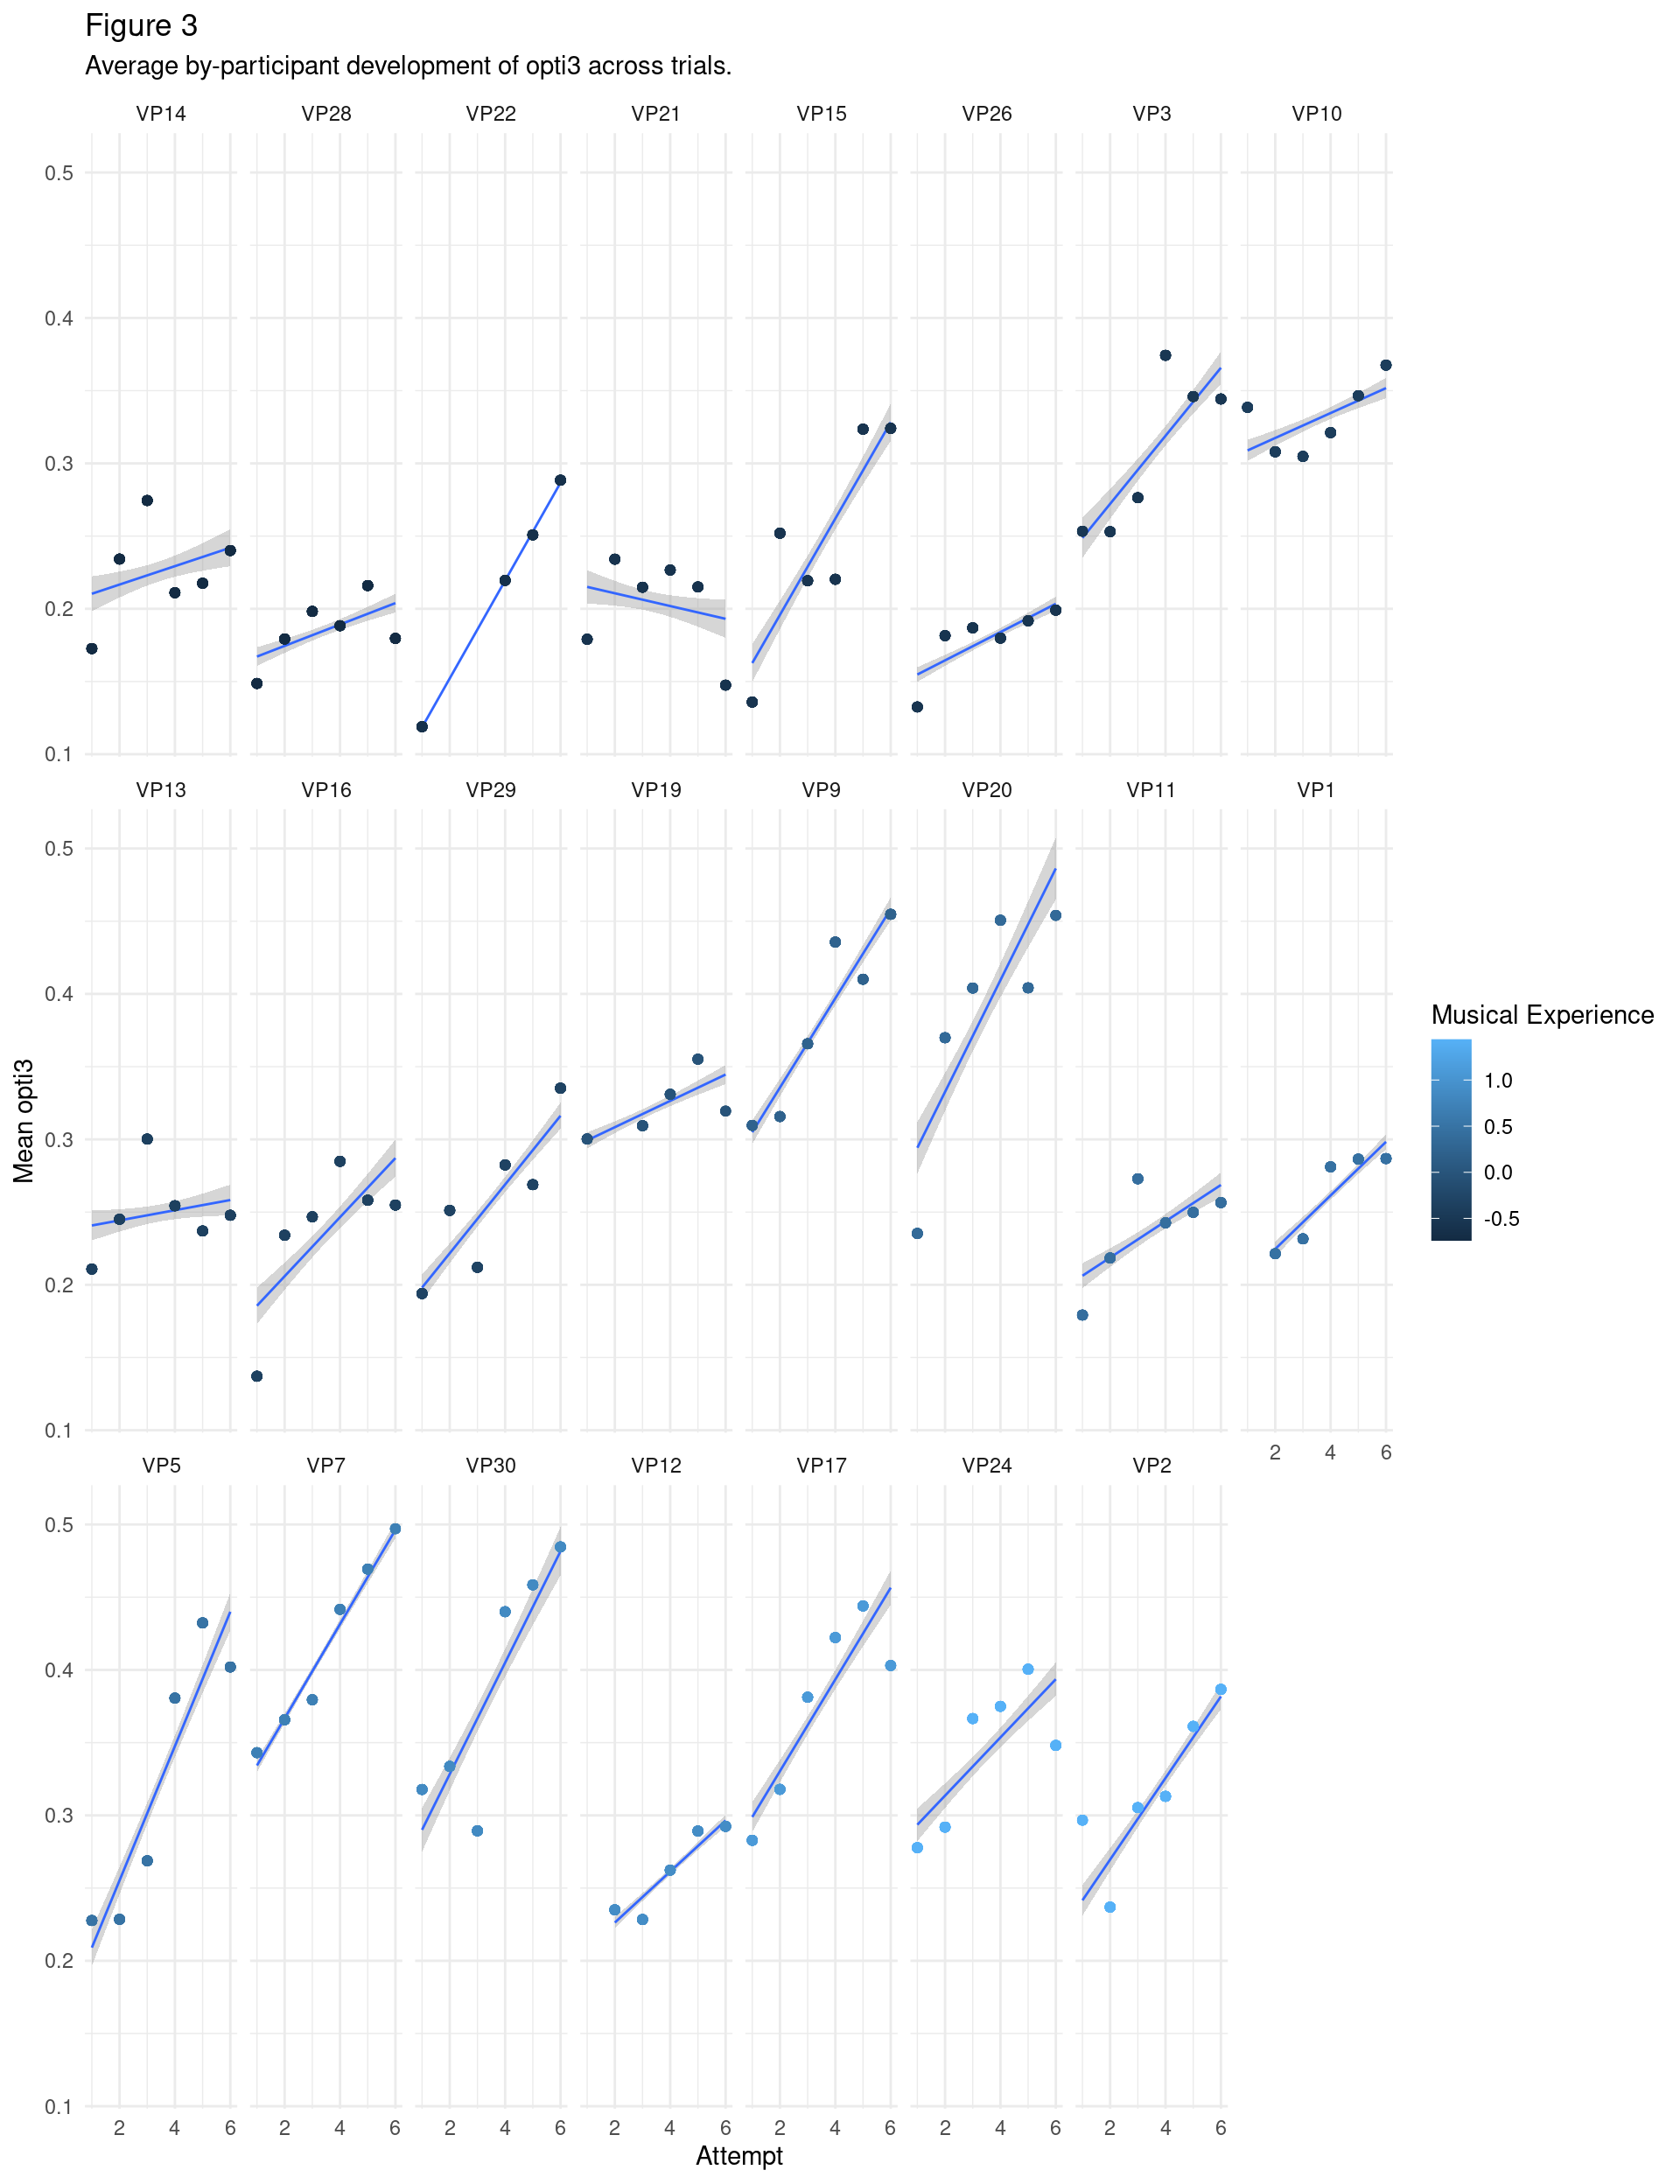
4.2 Average by-participant development of opti3
Another way of visualising differences in performance is at the level of participant, coloured and ordered by level of musical experience. This is useful since it invokes no false dichotimisations and preserves the actual unit of participant (however, note that participant-level effects are captured by our mixed effects models).
As shown in Figure 2, participants seem to have vastly different slopes. The bottom right, lighter blue, higher musical experience participants (e.g., VP5, VP7, VP30, VP12, VP17, VP24, VP2) seem to have steeper slopes than the lower musical experience participants in the top left, darker coloured (VP14, VP28, VP21), suggesting that higher musical experience is related to quicker learning. However, note that this pattern is not the same for everyone e.g., VP22 has a steep slope, but scores low on musical experience
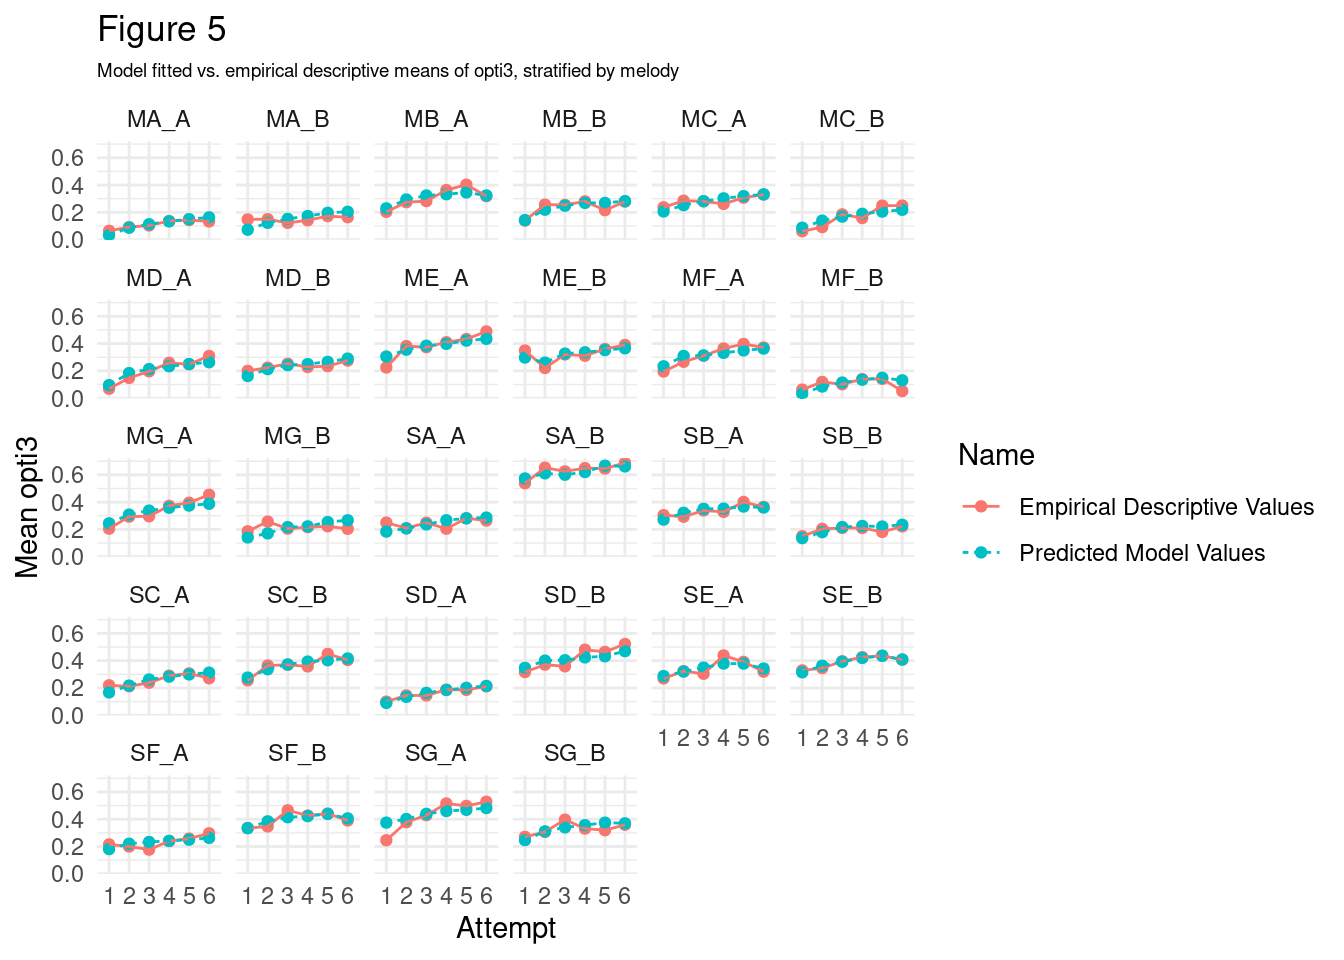
5 Average by-melody performance across attempts
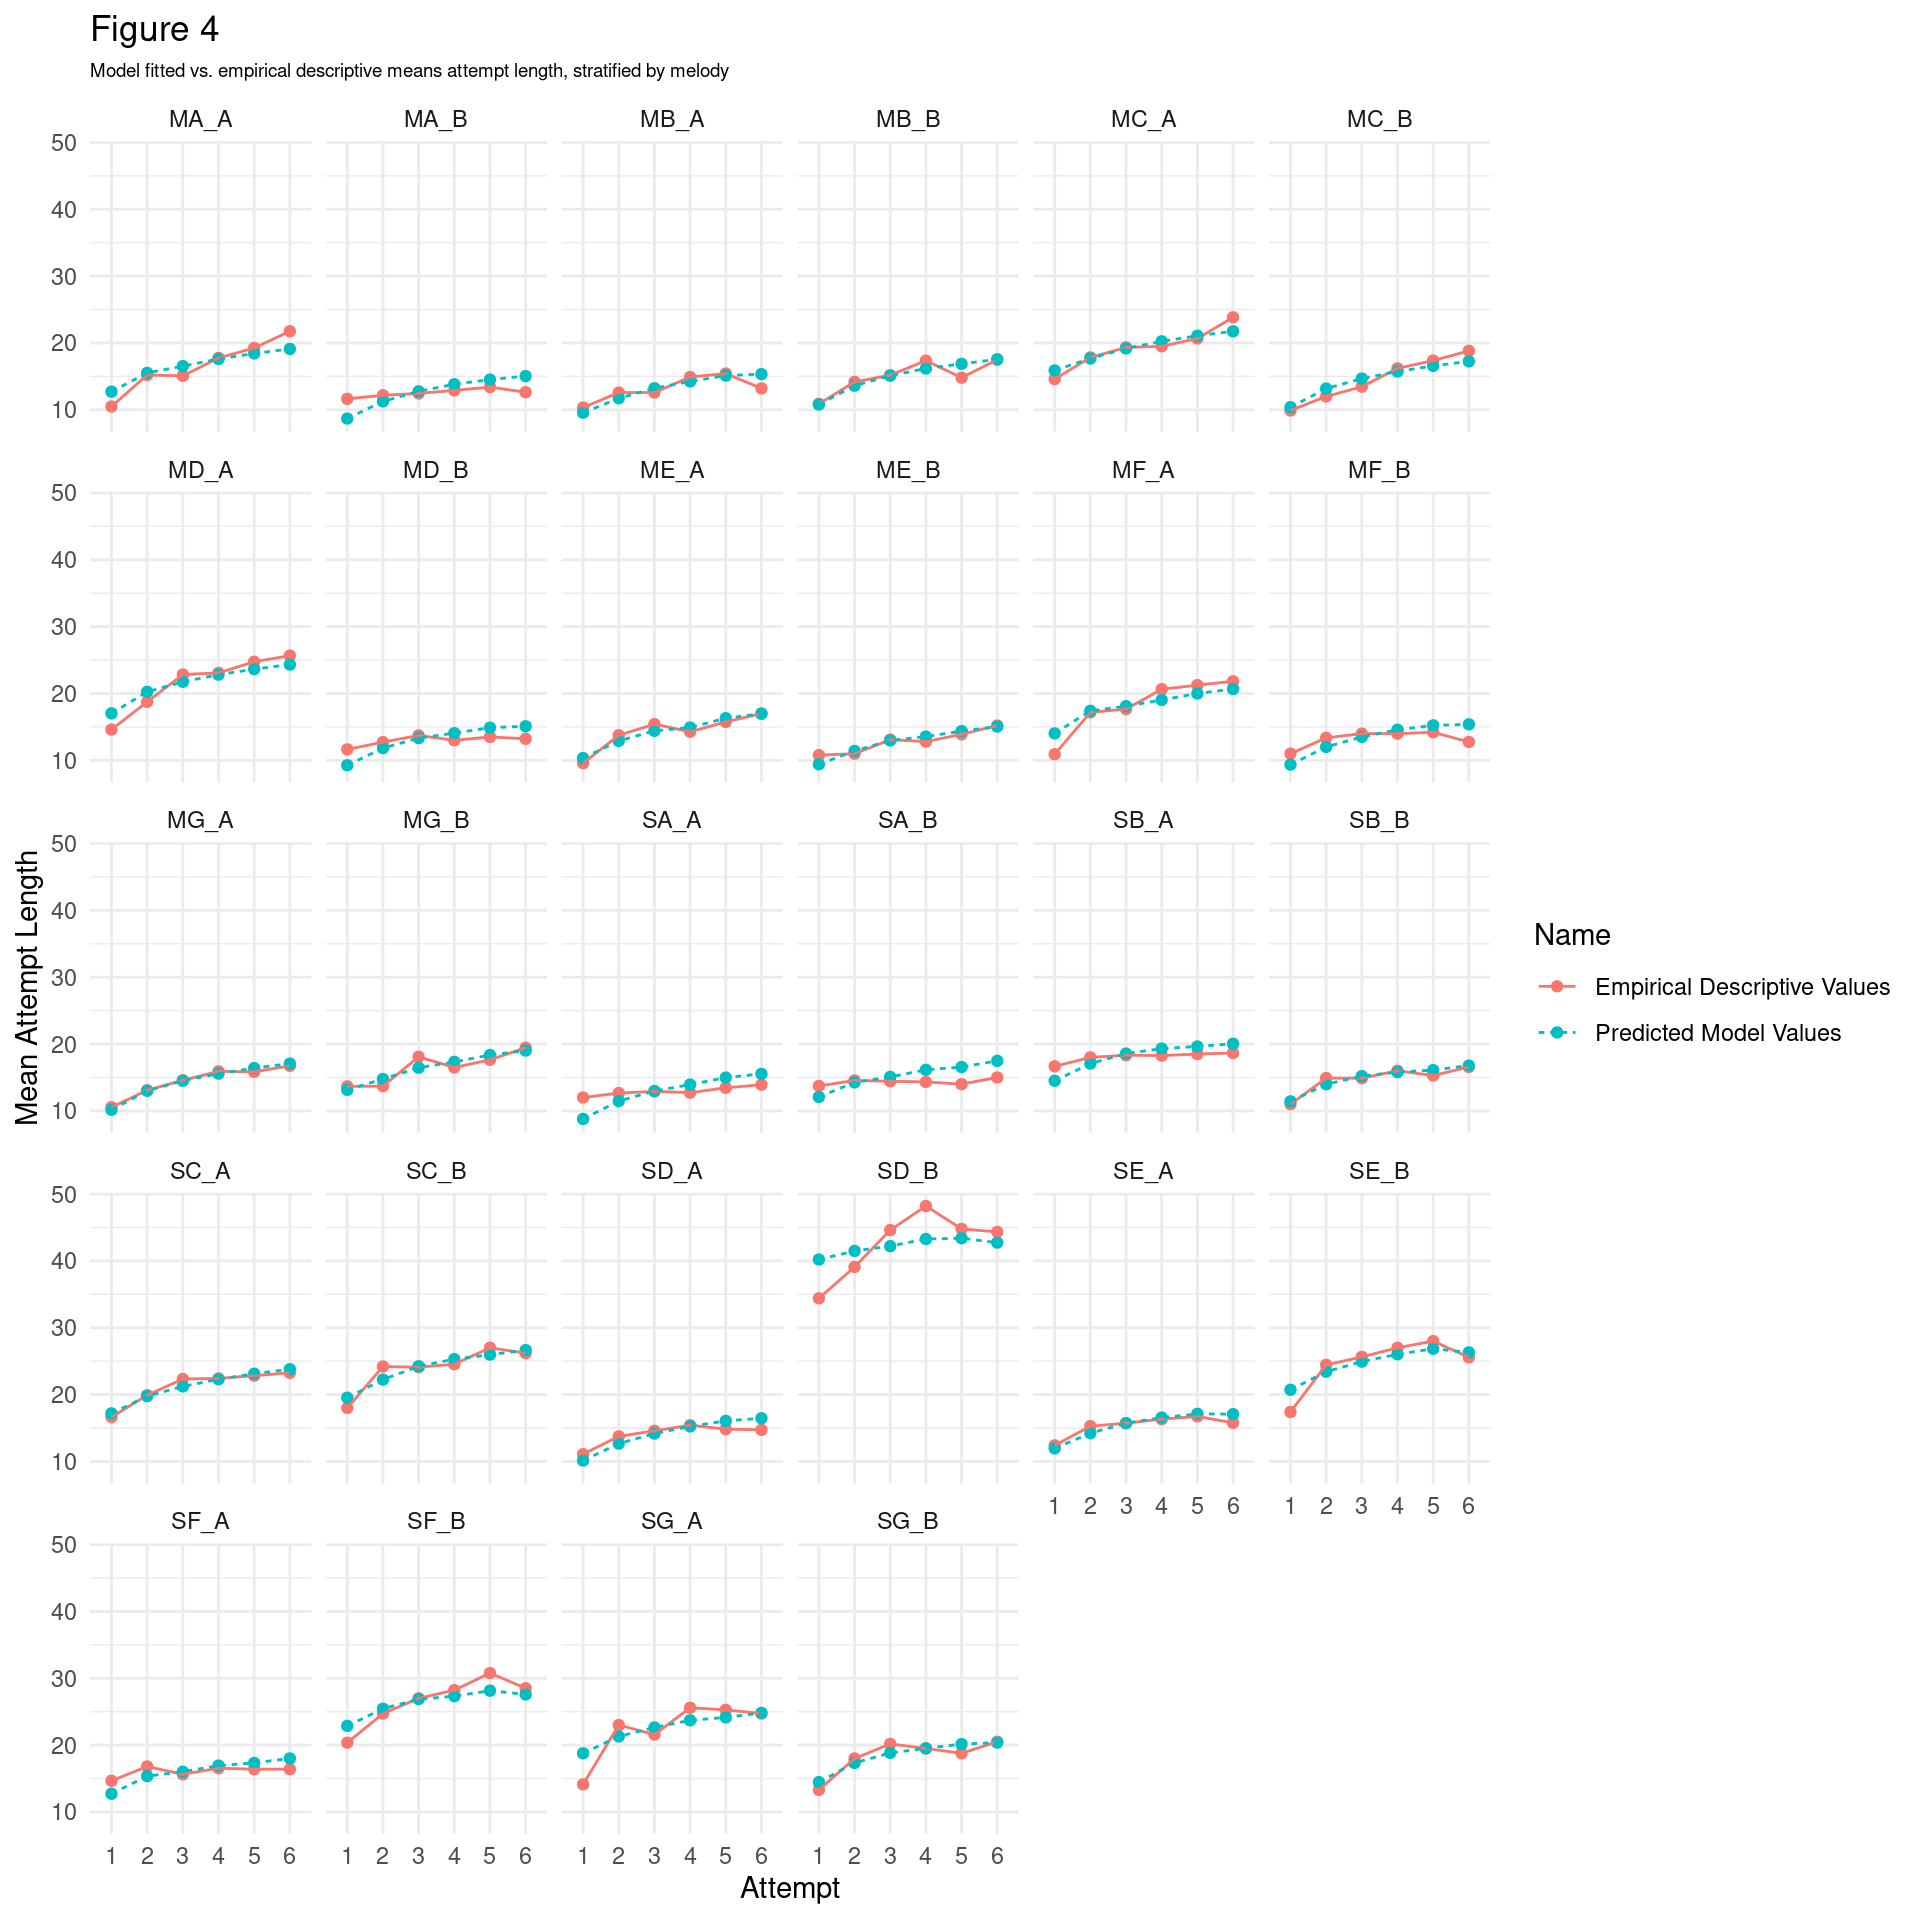
5.2 Average by-melody development of opti3
Melody SA_B appears to be the easiest melody to recall (mean opti3 across all trials = 0.61), whereas MF_B appears most difficult to recall (mean opti3 across all trials = 0.11). This shows that there can be substantial variation in the difficulty of each melody.
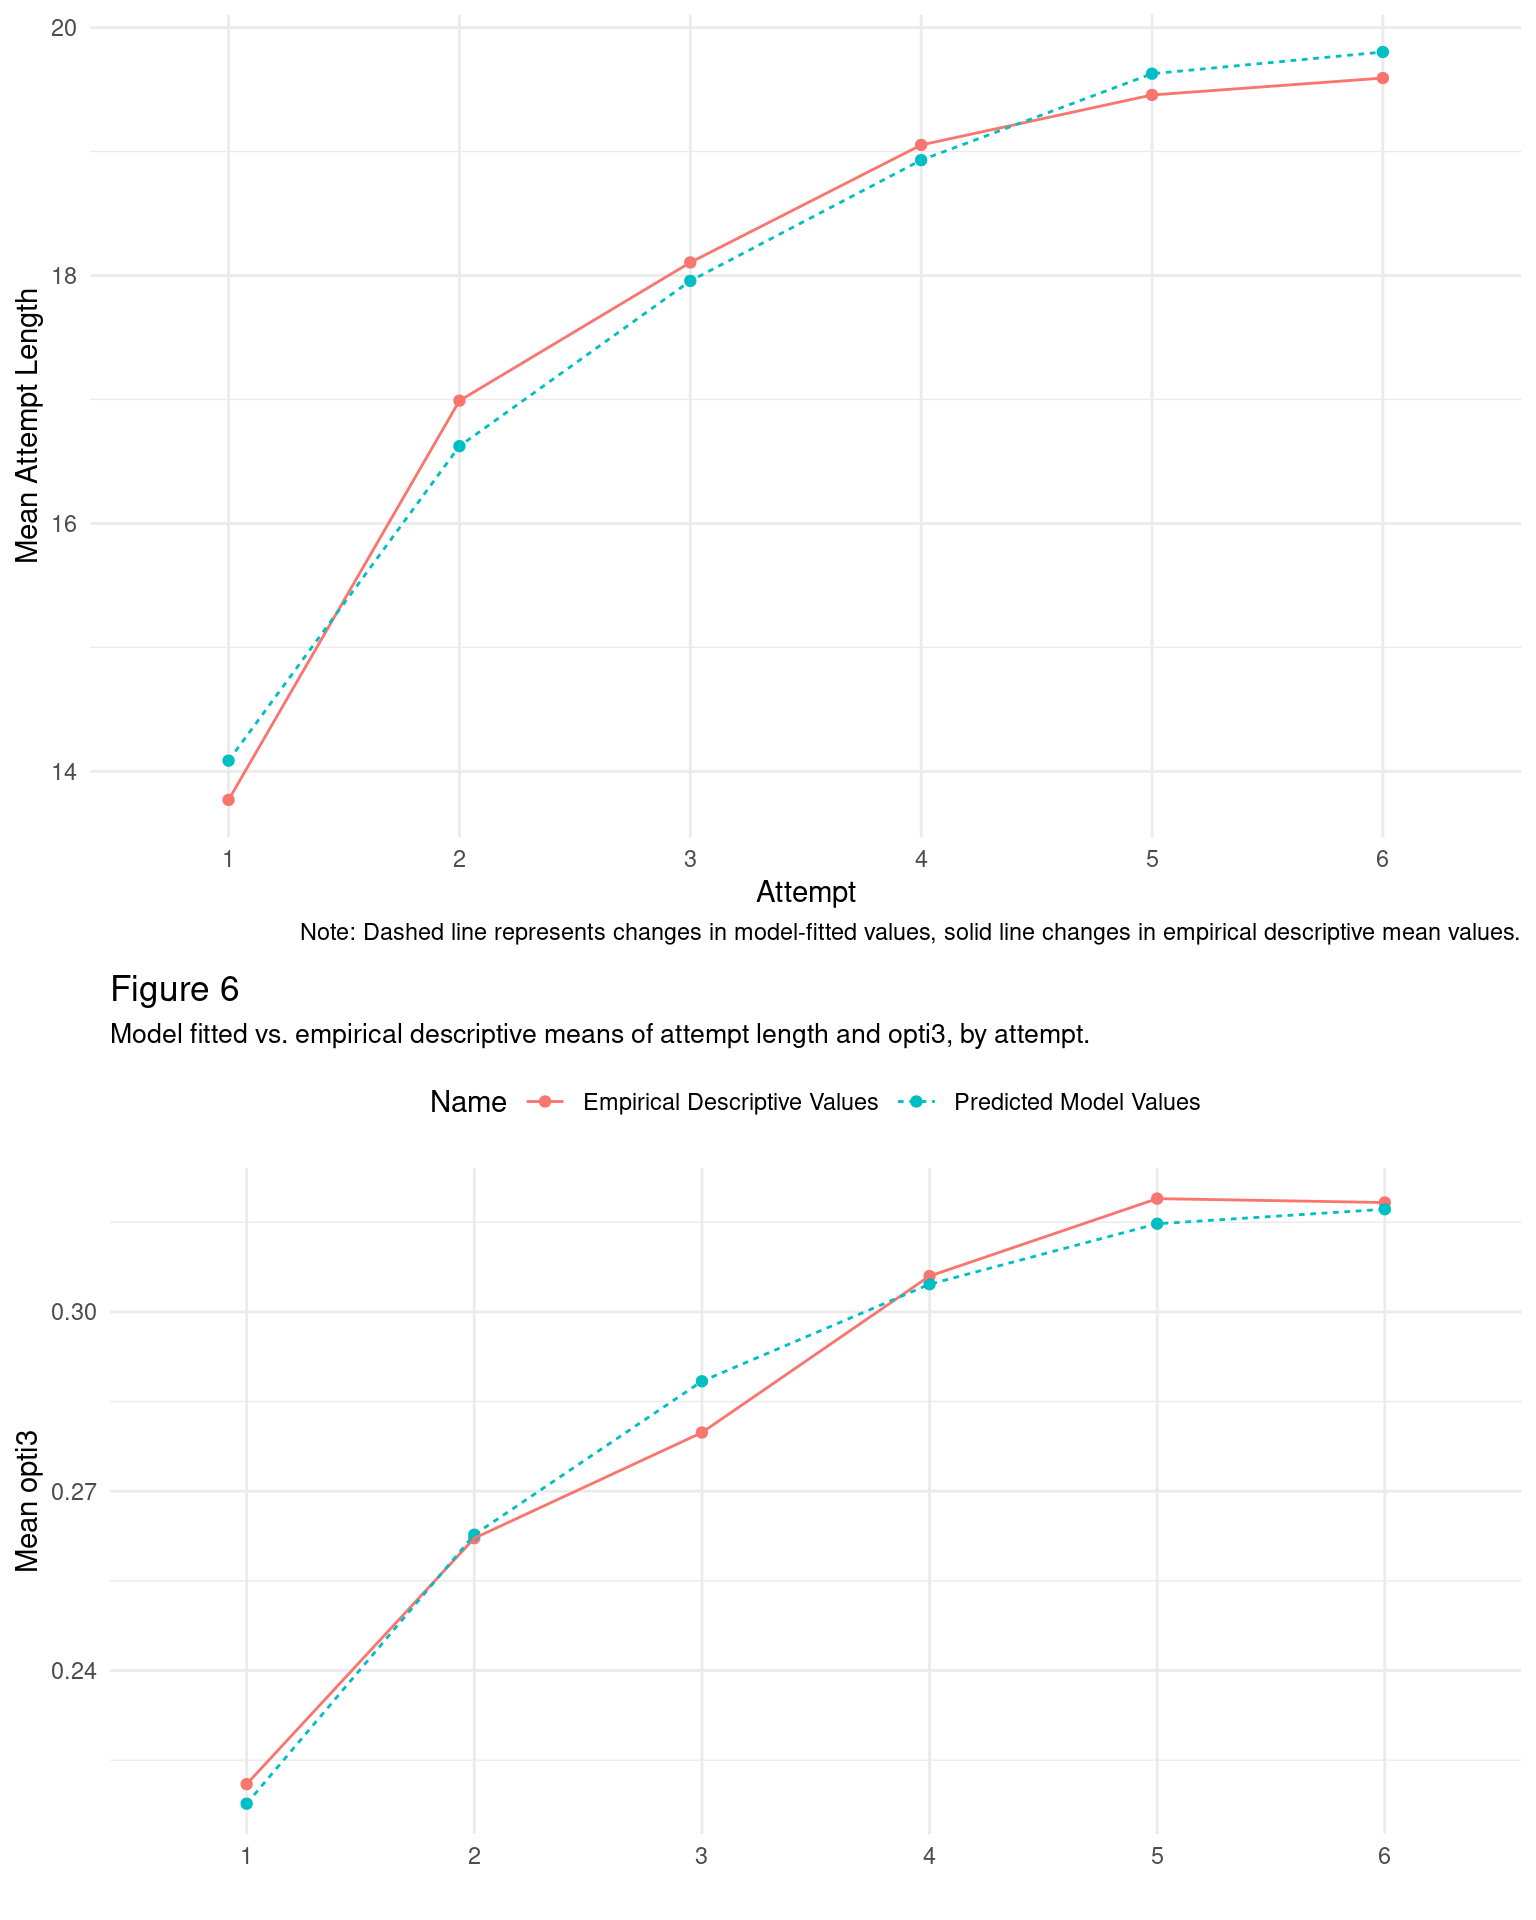
6 Linear vs. Non-Linear Models of dependent variables
We proceed by using the log attempt as numeric predictor, owing to the observed non-linearities in both opti3 and attempt length across attempt. A comparison of linear vs non-linear models is shown below.
6.1 Linear model of attempt length across repeated attempts
| Term | \(\hat{\beta}\) | 95% CI | \(t\) | \(\mathit{df}\) | \(p\) |
|---|---|---|---|---|---|
| Intercept | 13.72 | [11.12, 16.32] | 10.34 | 38.29 | < .001 |
| Attempt2 | 3.26 | [2.59, 3.92] | 9.63 | 1449.39 | < .001 |
| Attempt3 | 4.54 | [3.88, 5.20] | 13.45 | 1452.67 | < .001 |
| Attempt4 | 5.58 | [4.91, 6.25] | 16.30 | 1457.44 | < .001 |
| Attempt5 | 6.10 | [5.43, 6.78] | 17.62 | 1458.23 | < .001 |
| Attempt6 | 6.74 | [6.04, 7.43] | 19.01 | 1458.66 | < .001 |
Figure 6 shows that the use of the log attempt as predictor is justified, capturing the systematic non-linear pattern generally well.
6.2 Linear model of mean similarity scores (opti3) across repeated attempts
Table: (#tab:unnamed-chunk-30)
| Term | \(\hat{\beta}\) | 95% CI | \(t\) | \(\mathit{df}\) | \(p\) |
|---|---|---|---|---|---|
| Intercept | 0.22 | [0.17, 0.27] | 7.96 | 44.96 | < .001 |
| Attempt2 | 0.05 | [0.03, 0.06] | 5.02 | 1441.05 | < .001 |
| Attempt3 | 0.07 | [0.05, 0.09] | 7.36 | 1444.00 | < .001 |
| Attempt4 | 0.10 | [0.08, 0.12] | 10.58 | 1448.03 | < .001 |
| Attempt5 | 0.12 | [0.10, 0.14] | 12.47 | 1448.89 | < .001 |
| Attempt6 | 0.13 | [0.11, 0.15] | 13.23 | 1449.24 | < .001 |
7 Diagnostic statistics for models with all features in (partial R-squared and variance inflation factor values)
7.1 With attempt length as dependent variable
| Predictor | VIF |
|---|---|
| condition | 1.63 |
| log(attempt_numeric) | 1.00 |
| N | 4.59 |
| tonalness | 2.22 |
| i.entropy | 4.50 |
| step.cont.loc.var | 5.46 |
| d.entropy | 1.84 |
| mean_information_content | 4.58 |
| Effect | F | v1 | v2 | ncp | Rsq | upper.CL | lower.CL |
|---|---|---|---|---|---|---|---|
| Model | 188.68 | 8.00 | 1,763.00 | 1,509.42 | 0.46 | 0.49 | 0.43 |
| log(attempt_numeric) | 203.38 | 1.00 | 1,763.00 | 203.38 | 0.10 | 0.13 | 0.08 |
| N | 93.27 | 1.00 | 1,763.00 | 93.27 | 0.05 | 0.07 | 0.03 |
| conditionS | 84.95 | 1.00 | 1,763.00 | 84.95 | 0.05 | 0.07 | 0.03 |
| tonalness | 72.84 | 1.00 | 1,763.00 | 72.84 | 0.04 | 0.06 | 0.02 |
| d.entropy | 62.88 | 1.00 | 1,763.00 | 62.88 | 0.03 | 0.05 | 0.02 |
| step.cont.loc.var | 32.40 | 1.00 | 1,763.00 | 32.40 | 0.02 | 0.03 | 0.01 |
| mean_information_content | 0.57 | 1.00 | 1,763.00 | 0.57 | 0.00 | 0.00 | 0.00 |
| i.entropy | 0.02 | 1.00 | 1,763.00 | 0.02 | 0.00 | 0.00 | 0.00 |
7.2 With opti3 as dependent variable
| Predictor | VIF |
|---|---|
| condition | 1.58 |
| log(attempt_numeric) | 1.00 |
| N | 4.58 |
| tonalness | 2.19 |
| i.entropy | 4.46 |
| step.cont.loc.var | 5.45 |
| d.entropy | 1.78 |
| mean_information_content | 4.57 |
| Effect | F | v1 | v2 | ncp | Rsq | upper.CL | lower.CL |
|---|---|---|---|---|---|---|---|
| Model | 42.54 | 8.00 | 1,758.00 | 340.36 | 0.16 | 0.20 | 0.14 |
| mean_information_content | 139.38 | 1.00 | 1,758.00 | 139.38 | 0.07 | 0.10 | 0.05 |
| log(attempt_numeric) | 86.68 | 1.00 | 1,758.00 | 86.68 | 0.05 | 0.07 | 0.03 |
| i.entropy | 78.48 | 1.00 | 1,758.00 | 78.48 | 0.04 | 0.06 | 0.03 |
| conditionS | 72.03 | 1.00 | 1,758.00 | 72.03 | 0.04 | 0.06 | 0.02 |
| N | 35.68 | 1.00 | 1,758.00 | 35.68 | 0.02 | 0.03 | 0.01 |
| step.cont.loc.var | 2.26 | 1.00 | 1,758.00 | 2.26 | 0.00 | 0.01 | 0.00 |
| d.entropy | 0.44 | 1.00 | 1,758.00 | 0.44 | 0.00 | 0.00 | 0.00 |
| tonalness | 0.00 | 1.00 | 1,758.00 | 0.00 | 0.00 | 0.00 | 0.00 |
8 Counts of overall number of trials that participants utilise for multiple attempts
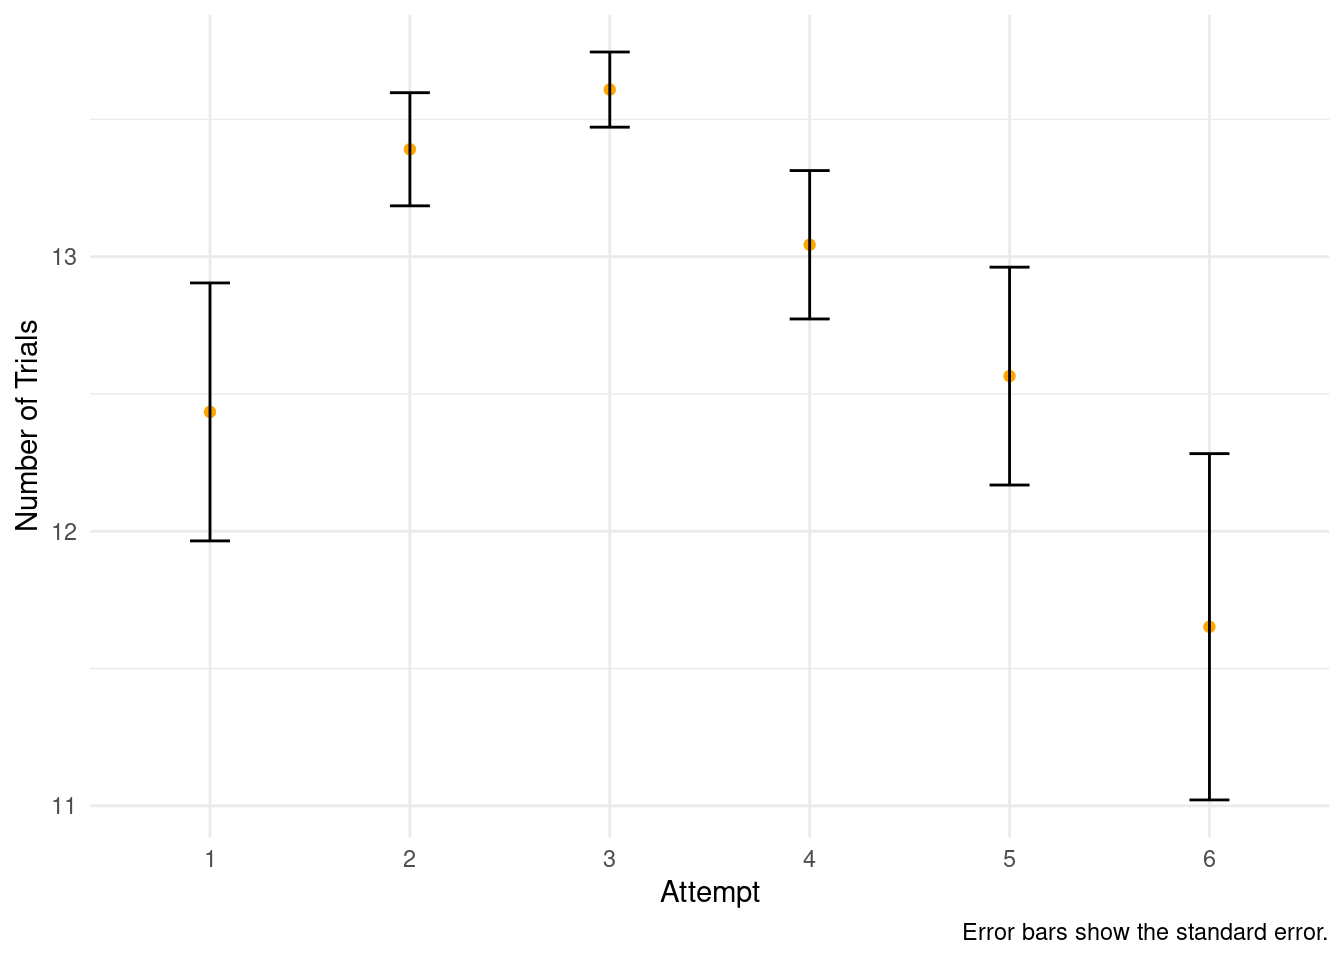
To assess whether the change across attempts depended on musical experience, we fitted a mixed effects model with trial count as the dependent variable, participant as random effect and the following fixed effects: linear terms for attempt and musical experience; an additional quadratic term for attempt; a linear interaction term for attempt and musical experience; and a quadratic interaction interaction term for musical experience. The model is presented below.
| Term | \(\hat{\beta}\) | 95% CI | \(t\) | \(\mathit{df}\) | \(p\) |
|---|---|---|---|---|---|
| Intercept | 11.51 | [10.24, 12.78] | 17.75 | 131.19 | < .001 |
| Attempt numeric | 1.27 | [0.48, 2.07] | 3.13 | 111 | .002 |
| Iattempt numeric^2 | -0.21 | [-0.32, -0.10] | -3.67 | 111 | < .001 |
| Musical experience | -0.51 | [-2.32, 1.29] | -0.56 | 131.19 | .579 |
| Attempt numeric \(\times\) Musical experience | 0.40 | [-0.73, 1.54] | 0.70 | 111 | .486 |
| Iattempt numeric^2 \(\times\) Musical experience | -0.07 | [-0.23, 0.09] | -0.91 | 111 | .366 |
9 Statistical models to support changes in similarity as a function of attempt and melody section
9.1 opti3
| Predictor | \(b\) | 95% CI | \(t\) | \(\mathit{df}\) | \(p\) |
|---|---|---|---|---|---|
| Intercept | 0.09 | [0.09, 0.10] | 115.14 | 133727 | < .001 |
| Melody sectionopti3 prim | 0.02 | [0.02, 0.02] | 24.11 | 133727 | < .001 |
| Melody sectionopti3 rec | 0.00 | [-0.01, 0.00] | -5.12 | 133727 | < .001 |
| Logattempt | 0.02 | [0.02, 0.02] | 36.15 | 133727 | < .001 |
9.2 ngrukkon
| Predictor | \(b\) | 95% CI | \(t\) | \(\mathit{df}\) | \(p\) |
|---|---|---|---|---|---|
| Intercept | 0.06 | [0.06, 0.06] | 66.75 | 133727 | < .001 |
| Melody section nngrukkon prim | 0.03 | [0.03, 0.03] | 37.07 | 133727 | < .001 |
| Melody section nngrukkon rec | 0.00 | [0.00, 0.00] | 0.00 | 133727 | .997 |
| Logattempt | 0.03 | [0.03, 0.03] | 52.09 | 133727 | < .001 |
9.3 rhythfuzz
| Predictor | \(b\) | 95% CI | \(t\) | \(\mathit{df}\) | \(p\) |
|---|---|---|---|---|---|
| Intercept | 0.22 | [0.21, 0.22] | 391.50 | 142691 | < .001 |
| Melody section rrhythfuzz prim | 0.00 | [0.00, 0.00] | -5.17 | 142691 | < .001 |
| Melody section rrhythfuzz rec | -0.01 | [-0.01, -0.01] | -13.43 | 142691 | < .001 |
| Logattempt | 0.03 | [0.03, 0.03] | 83.45 | 142691 | < .001 |
9.4 harmcore
| Predictor | \(b\) | 95% CI | \(t\) | \(\mathit{df}\) | \(p\) |
|---|---|---|---|---|---|
| Intercept | 0.36 | [0.35, 0.36] | 134.19 | 142691 | < .001 |
| Melody section hharmcore prim | 0.03 | [0.02, 0.03] | 11.24 | 142691 | < .001 |
| Melody section hharmcore rec | 0.00 | [0.00, 0.01] | 0.13 | 142691 | .899 |
| Logattempt | 0.02 | [0.01, 0.02] | 9.54 | 142691 | < .001 |