musicassessr technical details
technical_details.Rmd1. Usage of internal vs. external microphone
When comparing the effect of using an internal vs. external microphone, as self-selected by the user at the beginning of entry to the SAA test, the results published in our Behavior Research Methods paper (Silas, Müllensiefen, & Kopiez, 2023) suggest there is no difference in opti3 scores.
A mixed-effects model with microphone type as fixed-effects categorical predictor (External, Internal, Not sure) and participant as a random effect intercept revealed that there was no statistically significant difference in opti3 scores between the microphone types (p < .05). See the table below for model parameters.
This suggest that our audio transcription pipeline is relatively robust, once certain constraints have been fulfilled (e.g., a certain SNR).
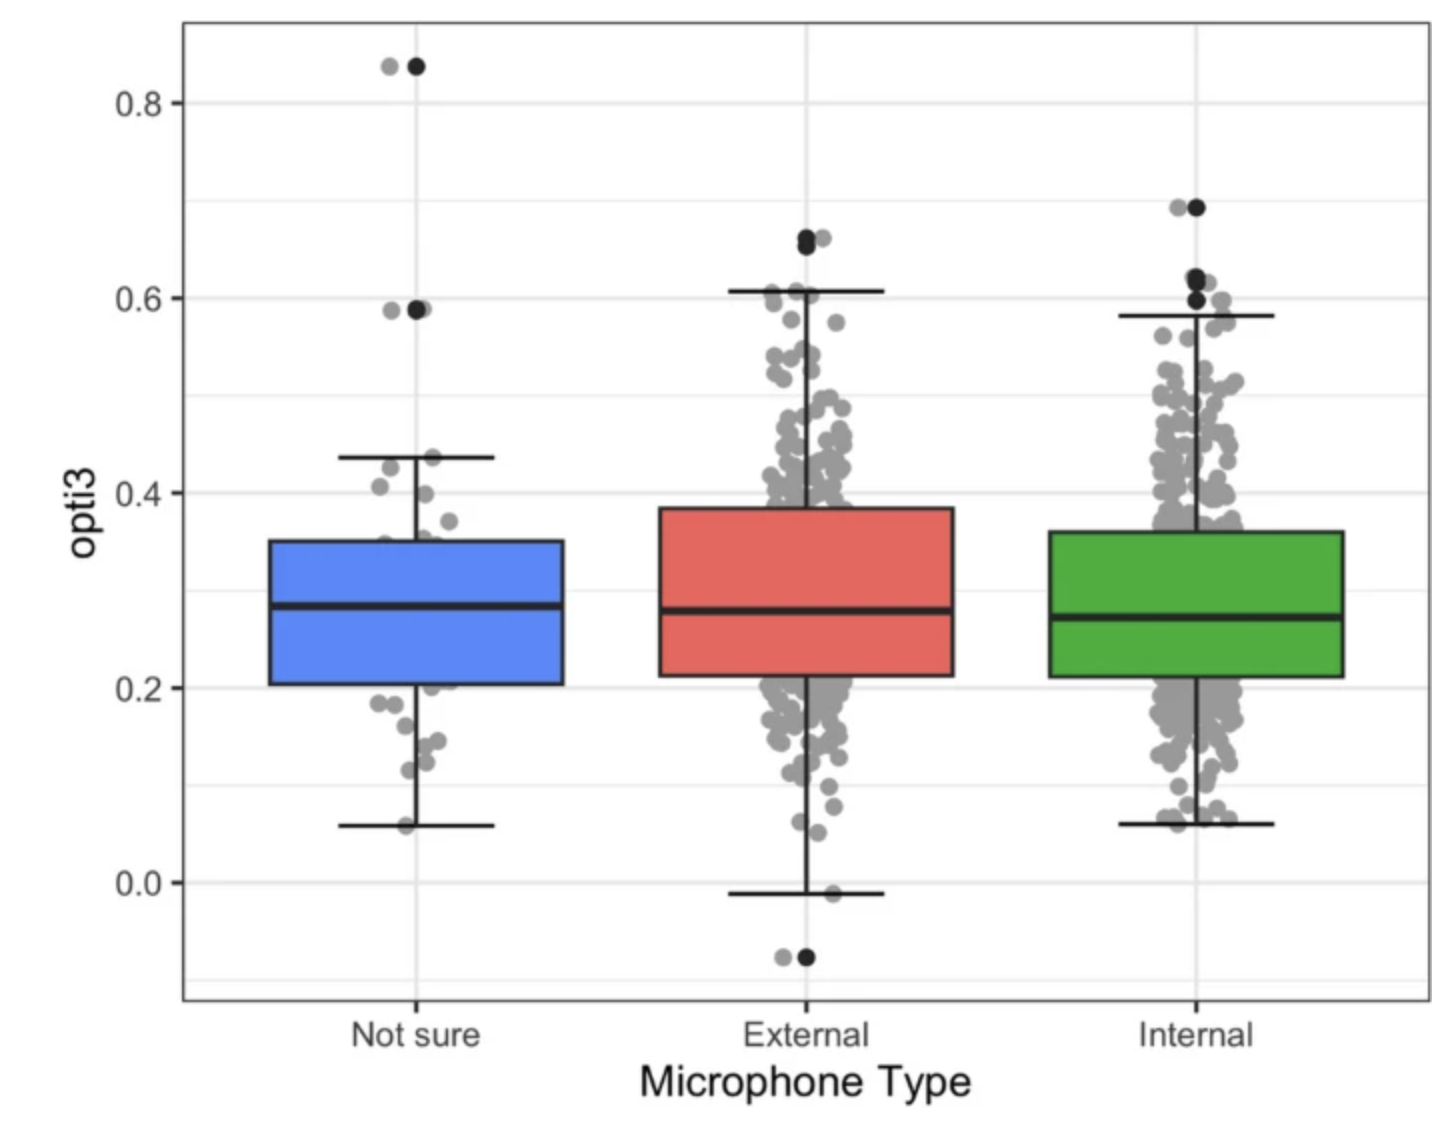
Boxplot, dot plot and SEM plot of opti3 for self-reported microphone type
2. Signal-to-noise ratio (SNR)
The graphs in Kim et al. (2018) suggest that the transcription accuracy of pitch detection algorithm we use (pYIN) starts failing from around a SNR < 14. Thus, we use this as the default cutoff for whether a participant can proceed with a test, if their SNR is collected before proceeding with the main trial blocks.
References
Kim, J. W., Salamon, J., Li, P., & Bello, J. P. (2018). Crepe: A Convolutional Representation for Pitch Estimation. 2018 IEEE International Conference on Acoustics, Speech and Signal Processing (ICASSP), 161–165. https://doi.org/10.1109/ICASSP.2018.8461329
Silas, S., Müllensiefen, D., & Kopiez, R. (2023). Singing Ability Assessment: Development and validation of a singing test based on item response theory and a general open-source software environment for singing data. Behaviour Research Methods. https://doi.org/10.3758/s13428-023-02188-0